
Data Storytelling
A couple of weeks ago i was asked to put together a 5-6 slide deck that describes one of my clients. The specific (and all) instructions i received were:
- Outline what your client’s core business problem/challenge/need is.
- Outline the key objectives of your work as it relates to solving that bigger business objective.
- Include data storytelling relating your work back to the problem, and tie back to creative recommendations/solutions you offered them to scale your work together to solve this problem (or ideas you have that may not have been implemented).
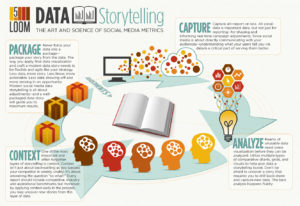
So what is Data Storytelling?
That was the question i asked myself because i thought that i had no idea. I’m naturally a sucker for data, and i always like to make visualizations of it – simply to better understand it! I didn’t know that was part of data storytelling! After searching online i came to the conclusion that what i have been doing is exactly what it is:
data storytelling is the process of translating data into “easy-to-understand” terms/visualizations to help influence a business decision or action.
How/why/when do you use Data Storytelling?
Just knowing what the definition is makes your brain start thinking about how/why/when to use data storytelling, right? Let’s break it down:
- How – It’s all about telling a story, using the data you have at hand – or what you can dig up. There are hundreds of ways to tell a data story. This is one way to structure it – according to JustStoryIt.com
- Context/the current situation
- The people involved – your characters. 1, 2, or 3 people with real names so listeners can identify with them and the story
- The problem (build urgency)
- Actions taken to solve the problem
- The resolution
- Action steps to take and a time frame for those (more urgency)
- Insights, key message, Inspiring close
- Why – Because it’s easy to understand. It allows you, the data storyteller, to examine a business problem/opportunity and then take actions based on what the data is telling you. It’s also easier for people who may not work closely with this data to better understand it when they see visuals.
- When – Use it all the time! Create a habit of telling stories with your data! It’s not always easy especially if you’re not used to it – but practice practice practice!
Resources
There are actually some resources you can use for free/subscribe to. One well known software is Tableau. They offer a free trial (and 1 year free if you’re astudent!!). Tableau helps people transform data into actionable insights.
Another great resource is Snapapp.com. In the article i’ve tagged, they’re breaking down 5 ways to impact your audience with data storytelling.
For more, check out our resources page!